The pathway to reducing emissions can't start without accurate data.
To tackle climate change, NYC has charted a path to reducing its greenhouse gas(GHG) emissions by 80% by 2050. With recently implemented Local Law 97(LL97), NYC aims to reduce the city's emissions by 40% by 2030 by requiring large buildings to reduce their emissions. Is NYC on track to meet this goal? We delved into the data to understand how much work needs to be done.
Large gaps in available data make it difficult to answer that question.
Currently, the city is missing GHG emissions data for about 40% of buildings covered by LL97. NYC Office of Sustainability estimates about 50,000 buildings will be covered without providing an official list of buildings covered by the law. This is the first challenge in understanding this question. Without an official list of buildings, it is difficult for building owners to be certain whether they are covered by the law and to map out NYC's progress and pathway for achieving LL97.
For our analysis, we developed an estimated list of covered buildings using criteria outlined in LL97. We found that about 50,000 buildings may be covered*, but the city only has emissions data for about 27,000 buildings.
Local Law 84(LL84) requires NYC's large buildings to disclose energy usage, providing the basis for LL97 data. With many limitations to the data, there is no comprehensive emissions dataset for all buildings covered by LL97--it will be difficult for the city to enforce the law and difficult for building owners to understand the actions they need to take in order to avoid fines in 2024.
*This is a very conservative estimate as we were unable to filter out all of the LL97 building exceptions. See methods for more details.
Using the arrows on the map below, slide between the two maps to view where data is missing.
Map caveats: The purpose of this map is to visualize the rough scale of data insufficiency with respect to LL97. This map is not intended to be fully accurate at the building level to indicate covered buildings. It is expected that some potentially non-covered buildings may be colored as covered due to the inabiltiy to accurate filter out all excpetions to LL97 (like Rikers Island).
50,000 buildings should be covered...
only 27,000 have emissions data
GHG Emissions by the Numbers
NYC's annual GHG emissions are 50.7 million metric tons of CO2 equivalent (mmtco2e).
Buildings are responsible for 70% of those emissions.
Covered buildings under LL84 emitted 19.5 mmtco2e in 2018.
*estimated emissions from 25,164 covered buildings
LL97 aims to reduce at least 5.3 mmtco2e by 2030 from covered buildings.
There is no clear way to determine the emissions limit for each building.
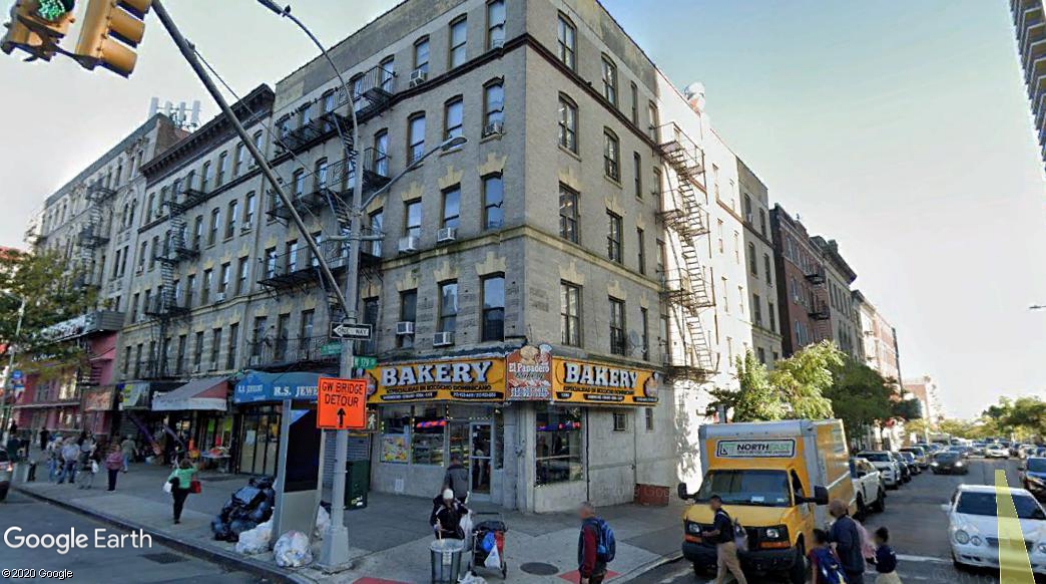
Even with emissions data, it's difficult to figure out how much emissions each building owner has to reduce. LL97 establishes different emissions limits based on building occupancy groups, which are based on building use. However, the existing LL84 disclosure dataset does not include the buildings' occupancy groups. Furthermore, there is currently, no easy method to match a building to its occupancy groups.
Moreover, NYC's buildings typically have multiple uses, with mixed-use buildings hosting a combination of functions including residential, commercial, medical, educational, institutional, and more. This results in multiple occupancy groups for a single building, which adds another layer of complexity, as how occupancy groups are defined affects the emissions limit for each building.
How far does the existing data take us?
With these data limitations in mind, we estimated the emissions impact that the currently available data would have if all LL84 covered buildings complied with LL97. We cleaned the data to only include private buildings with reported emissions greater than zero. Then, we self-assigned buildings a primary occupancy group based on their self-reported primary use. (See methodology section for details.)
- This resulted in 24,392 buildings (or 19,697 properties) with what we considered “usable” data.
- Of these, 6,219 buildings (4,266 properties) are non-compliant for the 2024 limit, meaning 25% of buildings require energy retrofits and improvements by 2024.
- If all of these buildings fully complied to reduce their emissions to the 2024 level, the aggregate emissions reduction would be 6,249,605 mtco2e.
If all 6,219 buildings reduce emissions to meet the 2024 level, the estimated impact in emission reduction is 6.2 mmtco2e.
That's almost 1 mmtco2e ahead of the minimum goal for 2030.
The importance of correct data.
We discovered there are serious limitations, caveats, and questions regarding the existing data that will make it challenging for NYC to be able to successfully implement LL97. However, despite the limited data, our analysis suggests that NYC can significantly surpass its 40% by 2030 goal at a faster and greater rate than planned. NYC could potentially surpass its goal by ~1 mmtco2e by 2024, six years ahead of time. Whether this can actually be achieved lies in the details of the data.
First and foremost, NYC needs to expand enforcement of LL84 reporting and develop a method and dataset to match buildings with their occupancy group. These issues must be ironed out soon, as the first emissions limit goes into effect in less than four years and retrofitting buildings requires significant time, effort, and investment. In order for these improvements to be made, building owners first need certainty about whether they are covered by LL97 and second, what their emission limits are. Accurate data will enable building owners to take the appropriate measures to comply with the law. Furthermore, without a clear understanding of which buildings are covered and their respective emissions limits, the city, specifically the new Office of Building Energy and Emissions Performance within the NYC Department of Buildings, will not be able to enforce the law and ensure that building owners reduce emissions. Without robust monitoring and enforcement, there may be little actual reduction in building emissions. By filling in the data gaps, NYC will be able to make progress in their pathway to reducing building emissions and reach the goal of 80% by 2050.
#GreenNewDeal4NY
On April 18, 2019, New York City passed its “Green New Deal,” the Climate Mobilization Act, a package of legislation that aims to reduce the city’s greenhouse gas (GHG) emissions by 80% by 2050.
At the crux of the Climate Mobilization Act is Local Law 97 (LL97), which aims to reduce the city’s building emissions 40% by 2030 from 2005 levels. LL97 aims to achieve this by requiring large buildings over 25,000 square feet to reduce their GHG emissions to certain levels by 2024 and 2030. If owners do not comply, they will face steep fines. Therefore, owners of affected (covered) buildings must start planning now to retrofit their buildings and make energy-related improvements to be able to comply with LL97.
A key component of successfully implementing LL97 is Local Law 84 (LL84), passed in 2009, which requires buildings over 50,000 square feet to annually report their energy usage. With a 2016 amendment (Local Law 133), LL84 now requires all buildings over 25,000 square feet to report energy usage. The data collected through LL84 is critical to ensuring that NYC can successfully monitor and enforce LL97.
2009: Local Law 84 passed
2019: Local Law 97 passed (part of Climate Mobilization Act)
2024: First set of building emission limits go into effect
2030: Second set of building emission limits go into effect
How We Cleaned our Data and Did our Analysis
Identifying Buildings Covered by Local Law 97
There currently is no official list of buildings that are covered by Local Law 97. However, the NYC Mayor’s Office of Sustainability has stated that 50,000 buildings across 22,000 properties are expected to be affected by LL97. In order to map these ~50,000 buildings, we used the 2020 PLUTO data to filter using the following criteria (obtained from the Urban Green Council) to estimate which buildings are covered by the new law:
- Any building on a property with an area (gross square feet) larger than 100,000 SF
- NO building on a property with an area smaller than 25,000 SF
- Any single building on a property with an area between 25,000 and 100,000 SF
- All buildings on properties between 25,000 and 100,000 SF where the total property floor area divided by the building count is greater than 25,000 SF (the number of equally sized buildings that could exist on that property are counted)
We then joined the resulting filtered list of PLUTO tax lots with the NYC Building Footprints. This results in approximately 50,000 covered buildings.
We recognize that this is not a fully accurate list of covered buildings as we were unable to accurately filter out all exempted building categories as listed in LL97. The data included in LL94 and PLUTO did not allow for clear filtering by the listed exception categories.
Covered Buildings with Data
To make the map of the covered buildings with emissions data, we used the 2019 Local Law 84 dataset. We removed all city buildings from the dataset resulting then joined the data with the NYC Building Footprints.
Gathering Building Emissions Data for Covered Buildings
We relied on the Local Law 84 Energy and Water Disclosure data for building emissions. However, the 2019 (calendar year 2018) LL84 data included only ~26,000 properties. We then filtered the data by the following steps to remove unusable entries:
- Removed all city buildings (city buildings are exempt from the LL97 limits and follow a different requirement)
- Removed all rows where reported total GHG emissions is zero or not available
- Removed all rows where the Source EUI is zero or not available
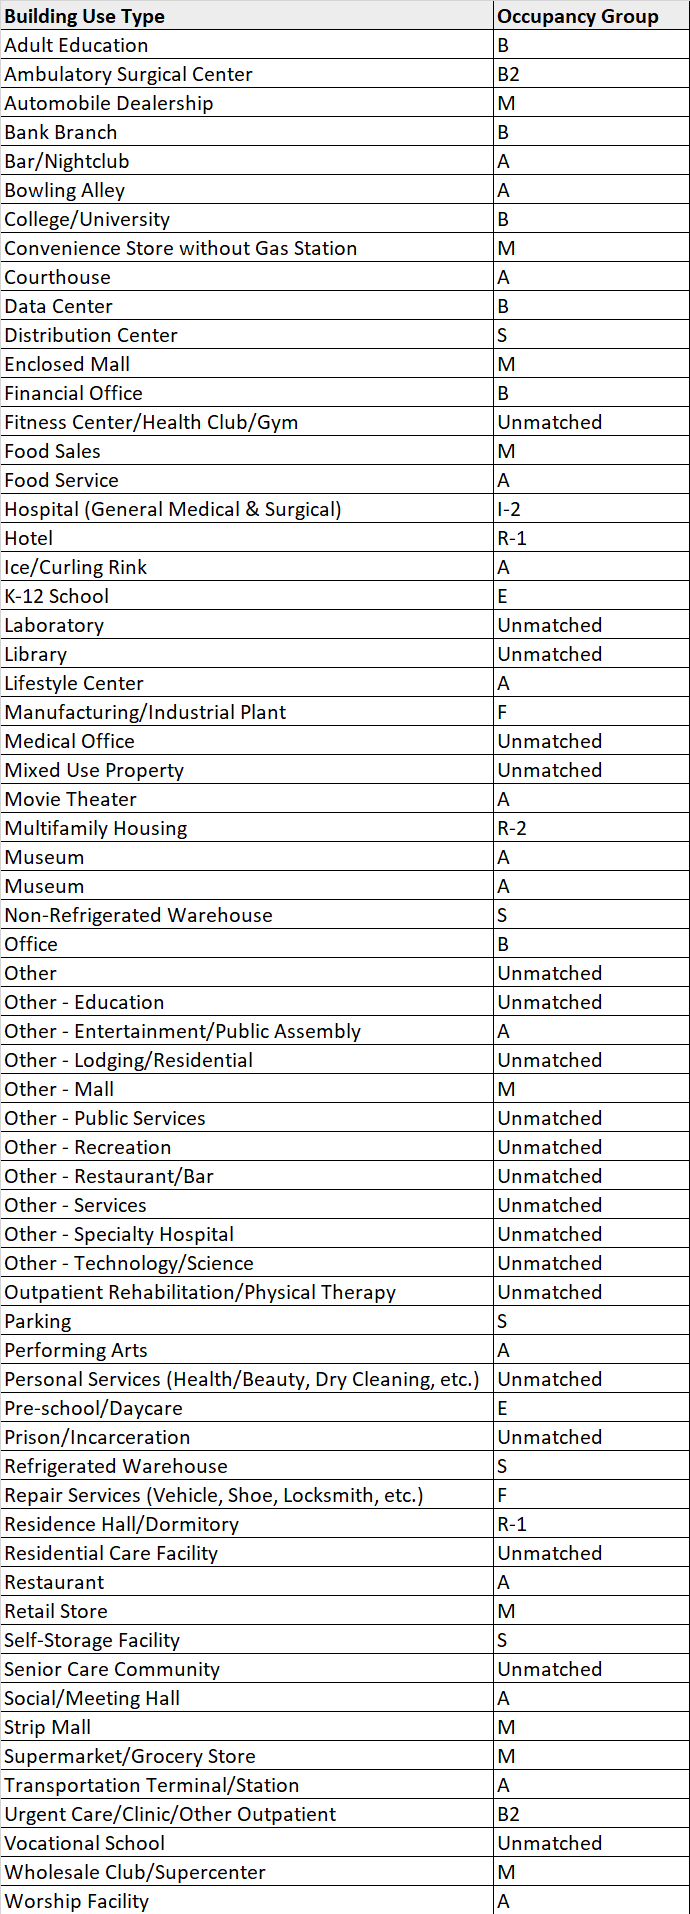
The LL84 data does not include building occupancy group, which is the category that the LL97 limits are based on. Therefore we manually assigned an occupancy group for each property based on its self-reported primary use type. We pulled all the unique use types and mapped them to an occupancy group by reading through the occupancy group definitions in the NYC Building Code. There were some reported use types that were difficult to categorize so we did not assign a group code to each use. We recognize that the occupancy group matching is likely to have errors. However, with no crosswalk between buildings or building class (in the PLUTO dataset) with occupancy group, this was the method we employed.
How We Assigned Occupancy Groups to Reported Building Uses
With building occupancy groups assigned, we then filtered out the buildings not assigned an occupancy group. This left us with 19,697 properties (24,671 buildings). We used the occupancy group to add the 2024 emissions intensity limit for all properties.
Calculating 2018 GHG Emissions
Instead of using the existing total GHG emissions column in LL84, we re-calculated emissions for each property using the emissions coefficients in LL97 for electricity, natural gas, fuel oil #2, fuel oil #4, and steam.
Then to calculate a 2018 GHG intensity for each property, we divided the total GHG emissions figure by the gross floor area. We were then able to compare the 2018 emissions intensity with the 2024 intensity limit to identify which properties are non-compliant and must take action to reduce emissions. We found that 4,266 properties (6,219 buildings) would be non-compliant if they did not take action. This amounts to approximately 25.5% of covered buildings. This is a little higher than the targeted 20% of most inefficient buildings, but not too off, which gives confidence in our analysis.
We did not include analysis of what the pathway looks like with respect to 2030 because the emissions coefficients for 2030 have not yet been determined. The emissions limit can vary greatly depending on the coefficient.
Exploring the Emissions Limit Impact Based on Occupancy Group
To explore the importance of the occupancy group of a building on its emissions limit, we looked at what the 2024 emissions intensity would be if occupancy group were assigned based on solely the primary use as well as top three reported uses. To do this, we matched the second and third uses to occupancy groups as well. We then calculated the floor area percentage of each use to calculate a weighted average of the emissions intensity limits.The reported square footage of the three uses did not always match the reported gross floor area so we added the square footage for the three uses to calculate our own total building area column. As can be seen in the two example buildings, how a building’s occupancy class is determined can have a significant impact on its emissions intensity limit and how much the building must be retrofitted.
Calculating the Projected Emissions Reduction from Covered Buildings by 2024
We calculated the amount of GHG emissions that each building must reduce by 2024 to be compliant by subtracting the 2024 intensity from the 2018 intensity. Then multiplied this by the total floor area (MTCO2e). Then summed this value for all 19,697 properties. This resulted in 6,248,851.6 million MTCO2e being reduced by 2024 if all buildings complied.
Webpage created: May 11, 2020